Logging 404s on a Cloudflare Pages website with a Cloudflare Worker
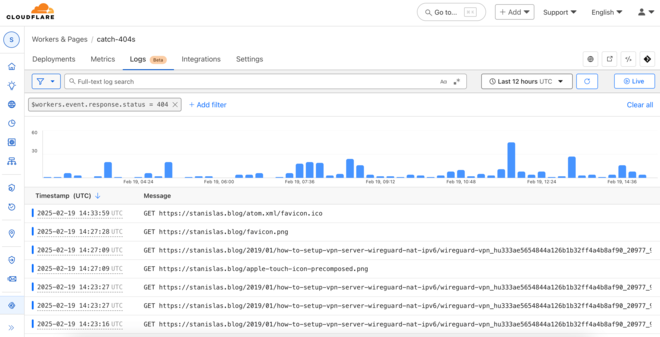
Table of Contents
This blog has been built with many different tools over the years, but it has been using Hugo for a while, which generates a static website. For the hosting, Cloudflare Pages has been my choice since then because it’s simple, fast, and cheap.
Going 404 hunting #
Recently, I noticed that I missed some redirections and had some dead links on my website.
Pages supports redirects which can be specified in a _redirect file like so:
➜  blog-hugo git:(main) ✗ head content/_redirects
/rss /feed.xml 301
/rss/ /feed.xml 301
/feed /feed.xml 301
/index.xml /feed.xml 301
/atom.xml /feed.xml 301

/lg-27ul850-broken-usb-c* /2020/02/lg-27ul850-broken-usb-c/ 301
/migrating-comments-from-isso-to-disqus* /2020/02/migrating-comments-from-isso-to-disqus/ 301
/understand-k8s* /2020/01/understand-k8s/ 301
/2-years-of-blogging-in-english* /2020/01/2-years-of-blogging-in-english/ 301
This is useful to rename article slugs, or in my case when I moved to dated permalinks a few years ago.
Concerning the dead links, my reflex would be to log in to my server and grep for 404s (or Kibana etc) to see if I had missed anything and if readers or bots ended up on 404 errors. But this is not my server here, so I started to look into Cloudflare Pages logs.
Logging on Cloudflare pages: broken and only streamed #
There is a Logs section on the Cloudflare dashboard, however it doesn’t work for me. I get the same error using the CLI:
➜ npx wrangler pages deployment tail

 ⛅️ wrangler 3.109.1
--------------------

✔ Select a project: › blog-hugo
No deployment specified. Using latest deployment for production environment.

✘ [ERROR] A request to the Cloudflare API (/accounts/47d71747660aab24284661867a77ed71/pages/projects/blog-hugo/deployments/385674e6-411d-4d17-a686-9996e53053ff/tails) failed.

  The requested Worker version could not be found, please check the ID being passed and try again.
  [code: 8000068]

  If you think this is a bug, please open an issue at:
  https://github.com/cloudflare/workers-sdk/issues/new/choose
This has never worked on my Pages deployment for as long as I remember (so, probably years), and I couldn’t find any fix on the web, even though I’m not the only one having this issue. I reached out to the support a few days ago to see if we can get it fixed, but haven’t heard back yet.
However, even if it worked, Pages logs are unfortunately only real time. You can stream the logs, but Cloudflare doesn’t store them:
Logs are not stored. You can start and stop the stream at any time to view them, but they do not persist.
If streaming worked, maybe I could just stream them and persist them myself, but right now this is not an option.
Logging with Cloudflare Workers #
I remembered my post Adding native image lazy-loading to Ghost with a Cloudflare Worker: maybe I could insert a Cloudflare Worker in front of my site to log 404 errors?
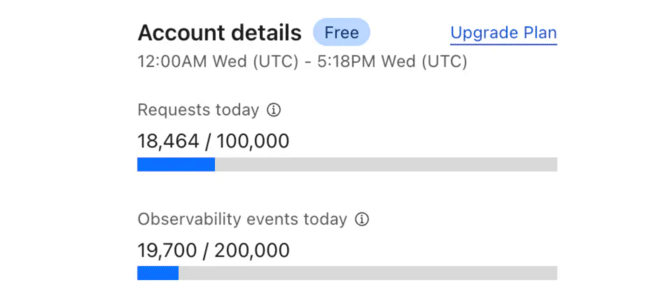
It turns out that Cloudflare Workers logging is much more advanced. First of all, logs are indeed persisted for up to 7 days which is enough for my use-case. And in the free plan, I can invoke a worker up to 100k times per day and I can log up to 200k logs per day which is also enough!
I am not sure why there is a difference between Pages and Workers in terms of logging, since the products seem to be so close together.

My Logger Worker #
I started a new worker in the Cloudflare console, and started experimenting.
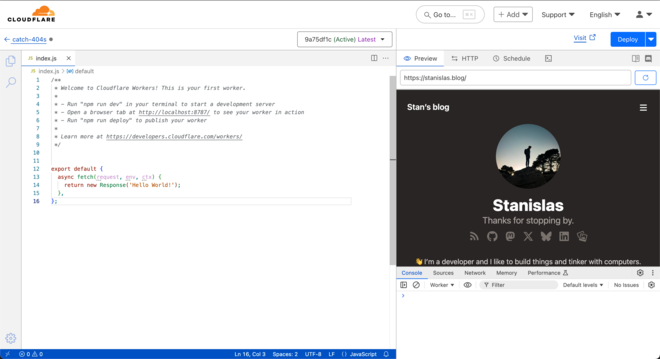
I needed to modify a few settings.
My worker is designed not to be standalone but to be run in front of my Pages website. Thus I disabled the *.workers.dev domains and added a route that matches stanislas.blog/*. That means that every request to the blog, the posts or any sub-resources like static assets would go through the Worker.
There are two processing modes for the workers:
- Fail closed (block): Additional requests will return an error page to your users. We recommend this option if your Worker does security checks.
- Fail open (proceed): Additional requests will bypass your Worker and proceed to your origin.
I’m fine with the free plan and I definitely don’t want visitors to see an error when I exhaust the 100k invocations threshold, so I chose the Fail Open mode.
Logging is not enabled by default, so I needed to enable it. But it turned that this setting doesn’t persist and was disabled again after each deployment.
I needed to use a wrangler.toml file to store the config, which means developing the project locally. Fortunately Cloudflare provides a nice way to continue working locally:
npx create-cloudflare@latest catch-404s --existing-script catch-404s
This creates a local project with the existing worker code in src/index.js and the config.
➜  catch-404s git:(master) ✗ tree -I 'node_modules'
.
├── package-lock.json
├── package.json
├── src
│   └── index.js
├── wrangler.jsonc
└── wrangler.toml

2 directories, 5 files
For some reason, there is wrangler.toml and a wrangler.jsonc, I had some issues until I discovered that the JSON one takes precedence over the TOML (I think?). I just deleted the JSON one.
Here is my config, with the routing configured and logs enabled:
compatibility_date = "2025-02-18"
main = "src/index.js"
name = "catch-404s"
preview_urls = false
workers_dev = false

[[routes]]
    pattern = "stanislas.blog/*"
    zone_name = "stanislas.blog"

[observability]
    enabled = false

    [observability.logs]
        enabled = true
        head_sampling_rate = 1
        invocation_logs = true
And I can deploy right from the terminal as well, it takes usually about 5 to 10s.
➜  catch-404s git:(master) ✗ npm run deploy

> [email protected] deploy
> wrangler deploy

Cloudflare collects anonymous telemetry about your usage of Wrangler. Learn more at https://github.com/cloudflare/workers-sdk/tree/main/packages/wrangler/telemetry.md

 ⛅️ wrangler 3.109.1
--------------------

✔ Select an account › Stanislas
Total Upload: 0.54 KiB / gzip: 0.32 KiB
No bindings found.
Uploaded catch-404s (3.67 sec)
Deployed catch-404s triggers (2.64 sec)
  https://catch-404s.angristan.workers.dev
Current Version ID: b87e17c9-6962-483a-9ed0-a4f480cb5579
Now, if we go back to the code, I experimented with something like this:
addEventListener('fetch', (event) => {
 event.respondWith(handleRequest(event.request));
});

async function handleRequest(request) {
  const response = await fetch(request);

  if (response.status === 404) {
    console.log('404 hit on:', request.url);
  }

  return response;
}
Which worked! If we look at the logs:
➜  catch-404s git:(master) ✗ npx wrangler tail

 ⛅️ wrangler 3.109.1
--------------------

Successfully created tail, expires at 2025-02-18T21:57:10Z
Connected to catch-404s, waiting for logs...
GET https://stanislas.blog/feed.xml - Ok @ 2/18/2025, 5:00:31 PM
GET https://stanislas.blog/atom.xml - Ok @ 2/18/2025, 5:00:36 PM
GET https://stanislas.blog/feed.xml - Ok @ 2/18/2025, 5:00:36 PM
GET https://stanislas.blog/robots.txt - Ok @ 2/18/2025, 5:00:42 PM
GET https://stanislas.blog/2020/04/nextdns/ - Ok @ 2/18/2025, 5:00:46 PM
GET https://stanislas.blog/ - Ok @ 2/18/2025, 5:00:47 PM
HEAD https://stanislas.blog/hey-this-is-a-404 - Ok @ 2/18/2025, 5:02:44 PM
  (log) 404 hit on: https://stanislas.blog/hey-this-is-a-404
I was also able to log more information about the request with:
console.log('Full request details:', {
    url: request.url,
    method: request.method,
    headers: Object.fromEntries(request.headers),
});
In order to get the IP, and interesting headers like the user-agent or the referrer to see where these requests come from:
  (log) Full request details: {
  url: 'https://stanislas.blog/hey-this-is-a-404',
  method: 'HEAD',
  headers: {
    accept: '*/*',
    'accept-encoding': 'gzip, br',
    'cf-connecting-ip': '<some-ip-address>',
    'cf-ipcountry': 'FR',
    'cf-ray': '913f3e422dab9eb0',
    'cf-visitor': '{"scheme":"https"}',
    connection: 'Keep-Alive',
    host: 'stanislas.blog',
    'user-agent': 'curl/8.7.1',
    'x-forwarded-proto': 'https',
    'x-real-ip': '<some-ip-address>'
  }
}
That’s everything I need!
The simplest worker ever #
Now, the invocations of the worker are already logged (like: GET https://stanislas.blog/ - Ok @ 2/18/2025, 5:00:47 PM). But don’t contain much information.
It turns out that the invocation logs do contain information, but we need to look at them on the web dashboard! They are rich HTTP logs which contains exactly what I was logging and more.
At that point, I realized that I could keep things as simple as it could get and use the Worker as the most simple reverse proxy possible:
export default {
    async fetch(request) {
        return fetch(request);
    },
};
The dashboard logs view supports full text search and the JSON is indexed which means I can filter by $workers.event.response.status = 404!

Performance impact #
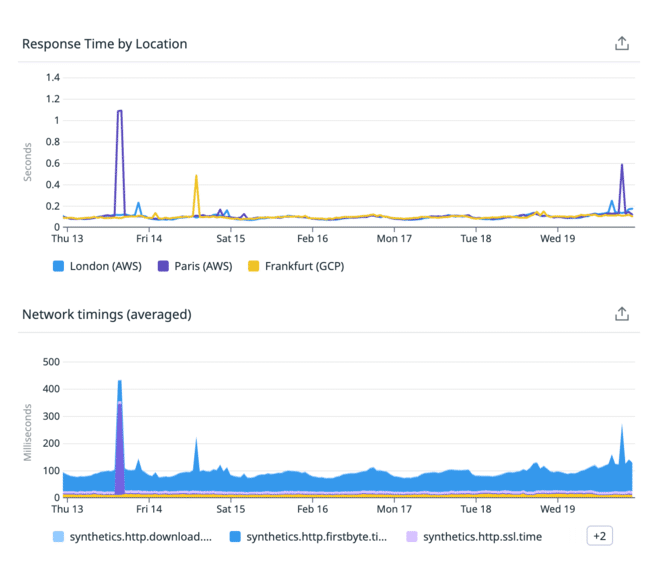
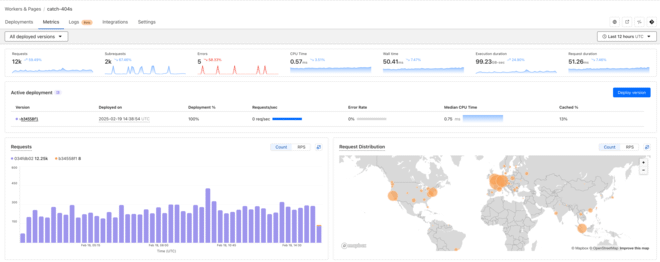
In terms of performance, adding an extra layer introduces some overhead, including processing time and additional network calls. However, the impact appears to be minimal, typically just a few milliseconds.

Continuing the 404 hunting #
This was already pretty helpful. In a next post, we’ll look at how I extended this worker to handle 404s, in a way that is not possible with the _redirects file.