Monitoring with Prometheus

Table of Contents
I talked a while ago about the monitoring stack I was using: TIG. I have moved to something else for the past year, so I wanted to talk about my experience with it.
This post won’t be a tutorial, for two reasons. First of all, it’s way too complex to be contained in single post, and secondly I have set up the whole stack using Ansible roles I made myself.
The main difference between a Telegraf + InfluxDB setup and Prometheus + Node Exporter is the exporter part. We could differentiate these as push mode and poll mode. Basically, Telegraf will push the metrics to InfluxDB while Prometheus will poll the data from Node exporter.
This will greatly impact your network setup. In one case, InfluxDB should be accessible by every machine. In the other, every machine should be accessible by Prometheus.
Node exporter is the software that will gather and export system metrics on every machine. It’s an exporter.
What is great about exporters is that there are many of them out there, and it’s very easy to make a custom one yourself. For example, if you want to gather metrics about your application, you just need to expose them using a specific but simple format at some endpoint. Tell Prometheus to gather data from that exporter, and you’re done!
Oh, I’m not saying this isn’t possible with Telegraf, but it’s not as convenient.
For my use case, I only used Node Exporter for system metrics along with Blackbox exporter for probing HTTPS endpoints (but it also supports ICMP, TCP, DNS…).
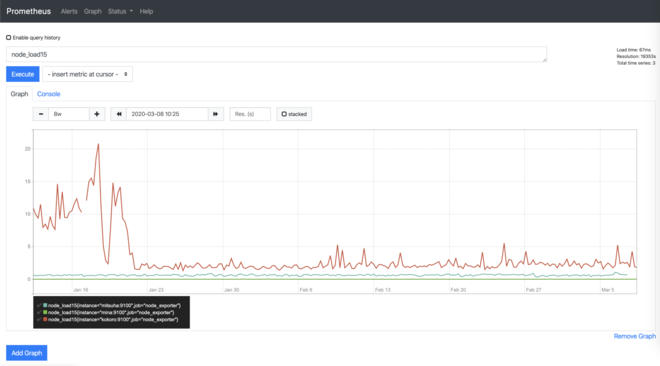
Prometheus itself has a basic web interface (and an API) where you can query metrics using PromQL and do some basic graphing.
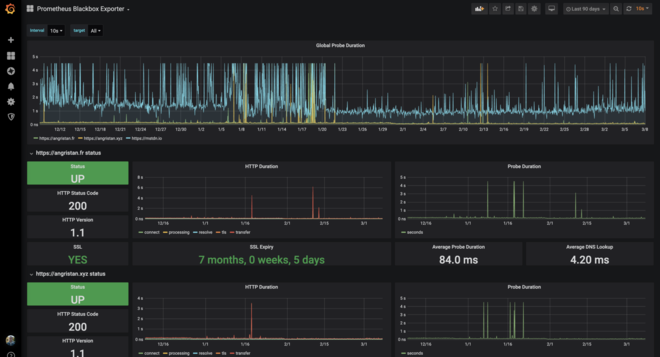
Of course, I was still using Grafana with pretty dashboards:
One thing I liked about Prometheus was its native alerting integration.
You can define rules as YAML:
groups:
- name: LoadAvg for Kokoro
  rules:
  - alert: KokoroLoadAvgWarning
    expr: node_load1{instance="kokoro:9100"} > 4
    for: 5m
    labels:
      severity: warning
  - alert: KokoroLoadAvgCritical
    expr: node_load5{instance="kokoro:9100"} > 6
    for: 5m
    labels:
      severity: critical
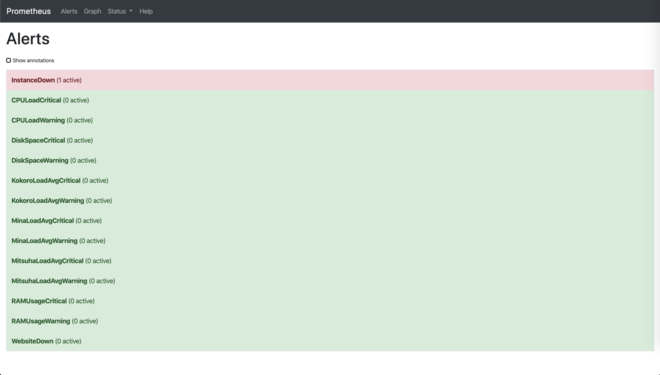
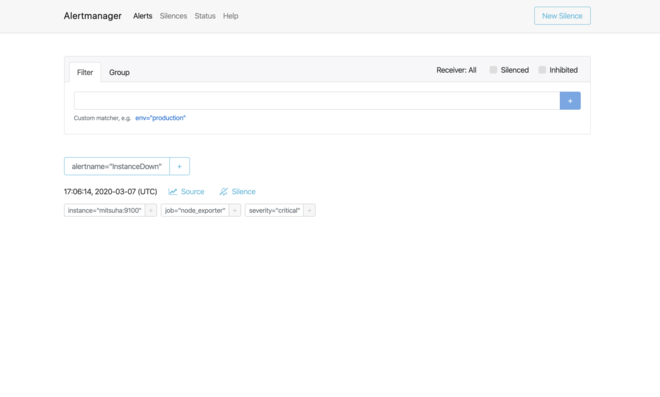
However to receive alerts you will need an additional software called Alertmanager, which can dispatch rules to a bunch of services.
The easiest and cheapest (well, free) way to received notifications upon alerts I found was… Slack.
I created a Slack workspace for myself, and then I hooked it up to Alertmanager.
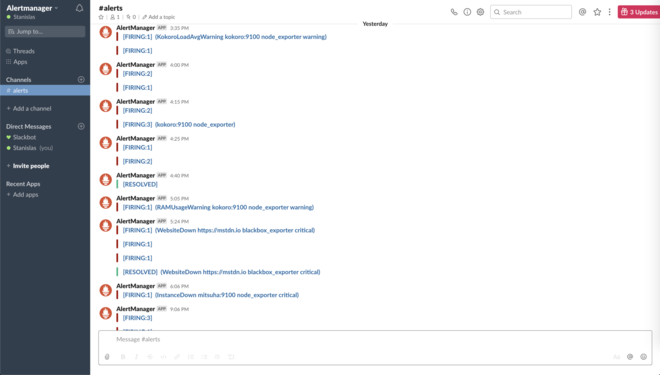
All of the Prometheus services are basically Go binaries that you have to deploy yourself, there is no packaging. This is great because you can set them up however you want, but it’s more work keeping them up-to-date. I have to admit I used to keep my roles and servers up-to-date each new release at first, but I haven’t updated anything in months.
Worth it? #
After spending a lot of time understanding all the components and setting them up, my setup as been running smoothly for months now. I’m not sure I would recommend it though, as it’s probably overkill for most setups and it requires lots of lines of configuration.
It makes sense at $work where we have tons of metrics and we rely on proper alerting, but I’m not that demanding for my personal services.
I also feel like Prometheus is not made of long-term metrics. At my previous work we had to reduce the retention to about 2 weeks on some instance because it would consume an enormous amount of RAM. It was being filled with tons of Kubernetes metrics though.
It’s been fun to play with it though! I just switched back to Telegraf + InfluxDB + Grafana and seeing how much simpler setting them up is, my thoughts have been confirmed. That’s my setup of choice!
Ansible roles #
The good thing is that if I ever want to go back to my Promethus stack, my Ansible roles will help me get the job done easily.
Here are the roles I made and used:
I’m not really expecting anyone to use them, but they are working and documented, so at least they can serve as a source of inspiration.